How to become a data journalist: day 2
The second day of the School of Data Journalism in Perugia saw two workshops introducing aspiring data journalists to core skills of the profession.
Prof. Steve Doig and investigative journalist Heather Brooke approached the topic of how to gain free access to information, which in Italy is still one of the main issues in the field of information and open data.
The first workshop of the day, entitled Information Wants to Be Free, stressed the importance of being public even about the possible rejections you might face from the authorities you are seeking to retrieve data from. “When you are refused access to the information you need for a story, write a piece about it. It doesn’t mean the story goes away. Always remember you are acting as a representative of the public and the public does care about how their money is spent.” said Doig.
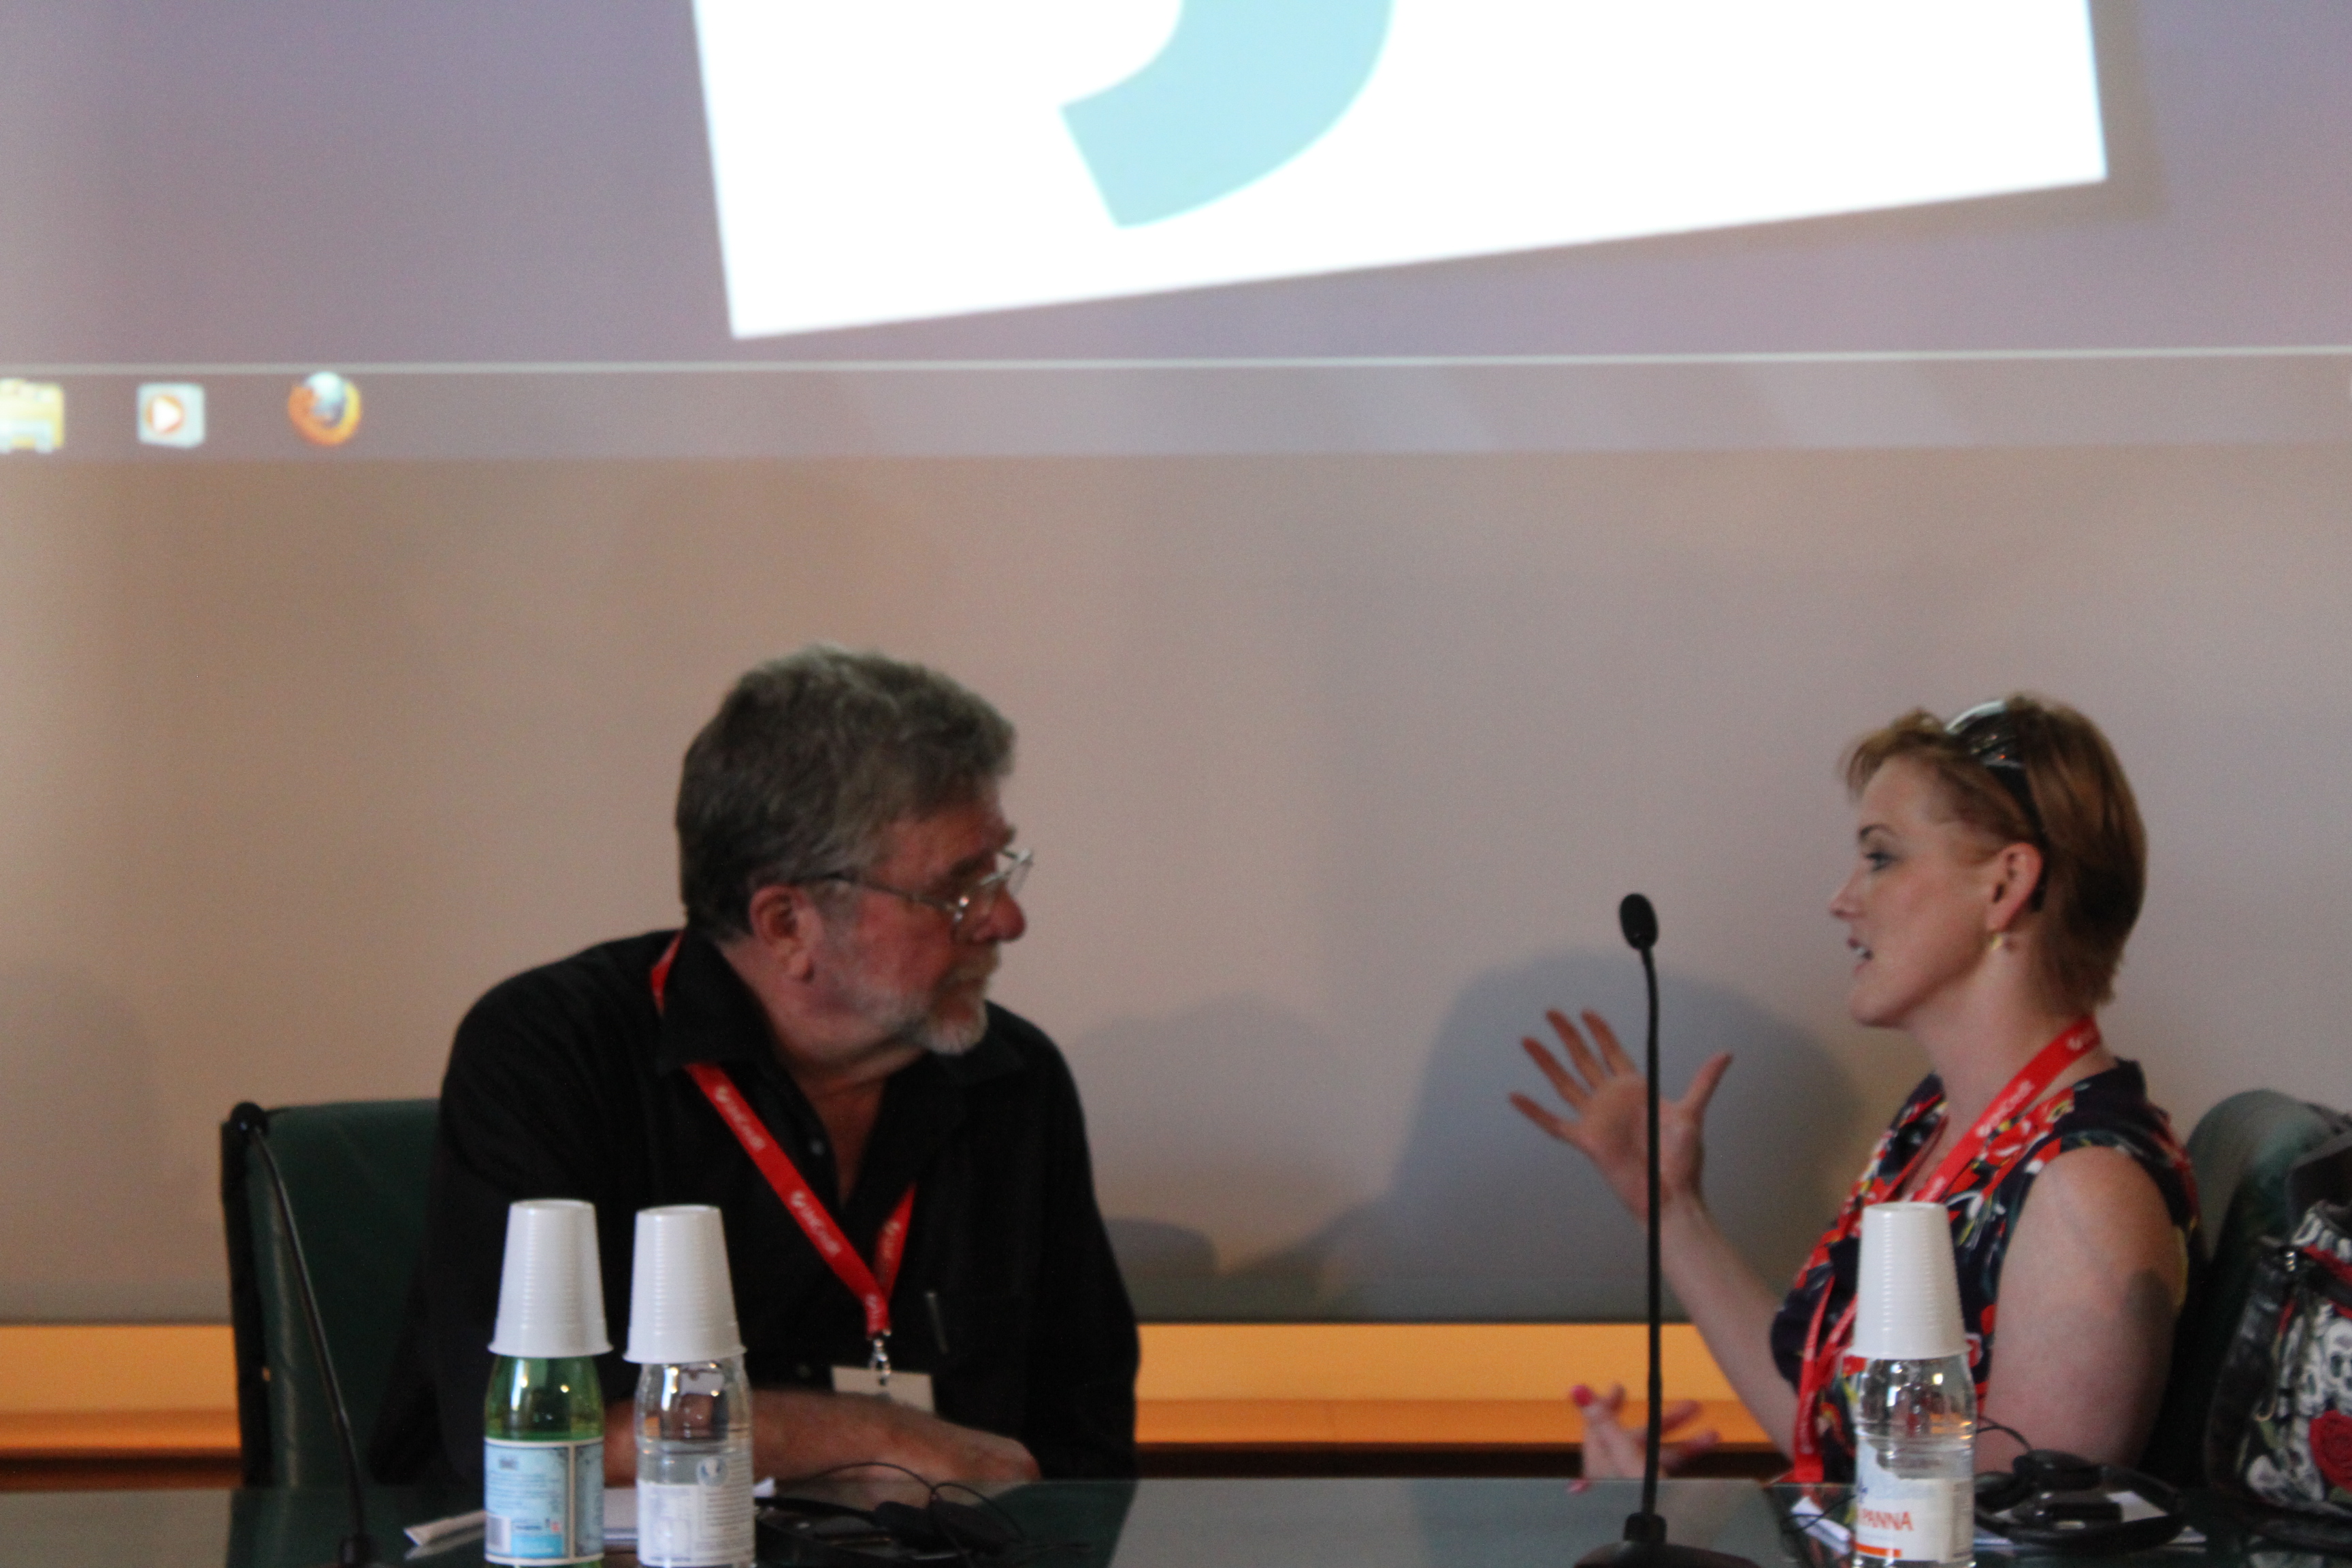
Steve Doig and Heather Brooke discussing before the workshop
It may also happen that, if the authorities do not push you away directly, they may try to charge extortionate prices to deliver the data you need. Doig invites journalists to ask for a formal cost breakdown which would justify the amount authorities want to charge: ” Once you do this they will start reconsidering their position”.
Heather Brooke is very active as a campaigner for the freedom of information wants open data to become a statutory right and not an exceptional procedure only a few people are familiar with. “Most people don’t think of the documentation behind public life. Everything that happens in society produces some kind of dataset which becomes a goldmine for journalists. Data journalism is about identifying the sources of the information” she said.
The speakers were later joined by Helen Darbishire, founder of Access Info Europe, who briefed the audience on the practicalities of how to forward a Freedom of Information Request to public bodies. “I suggest everybody to have a look at the Legal Leaks handbook. FOI is just one of the information gathering strategies journalists can follow, but there are many different sources that can be accessed. Think laterally and don’t give up searching. Never assume you are either going to get information or not. You don’t know where and when you will get it but it is always worth trying.”
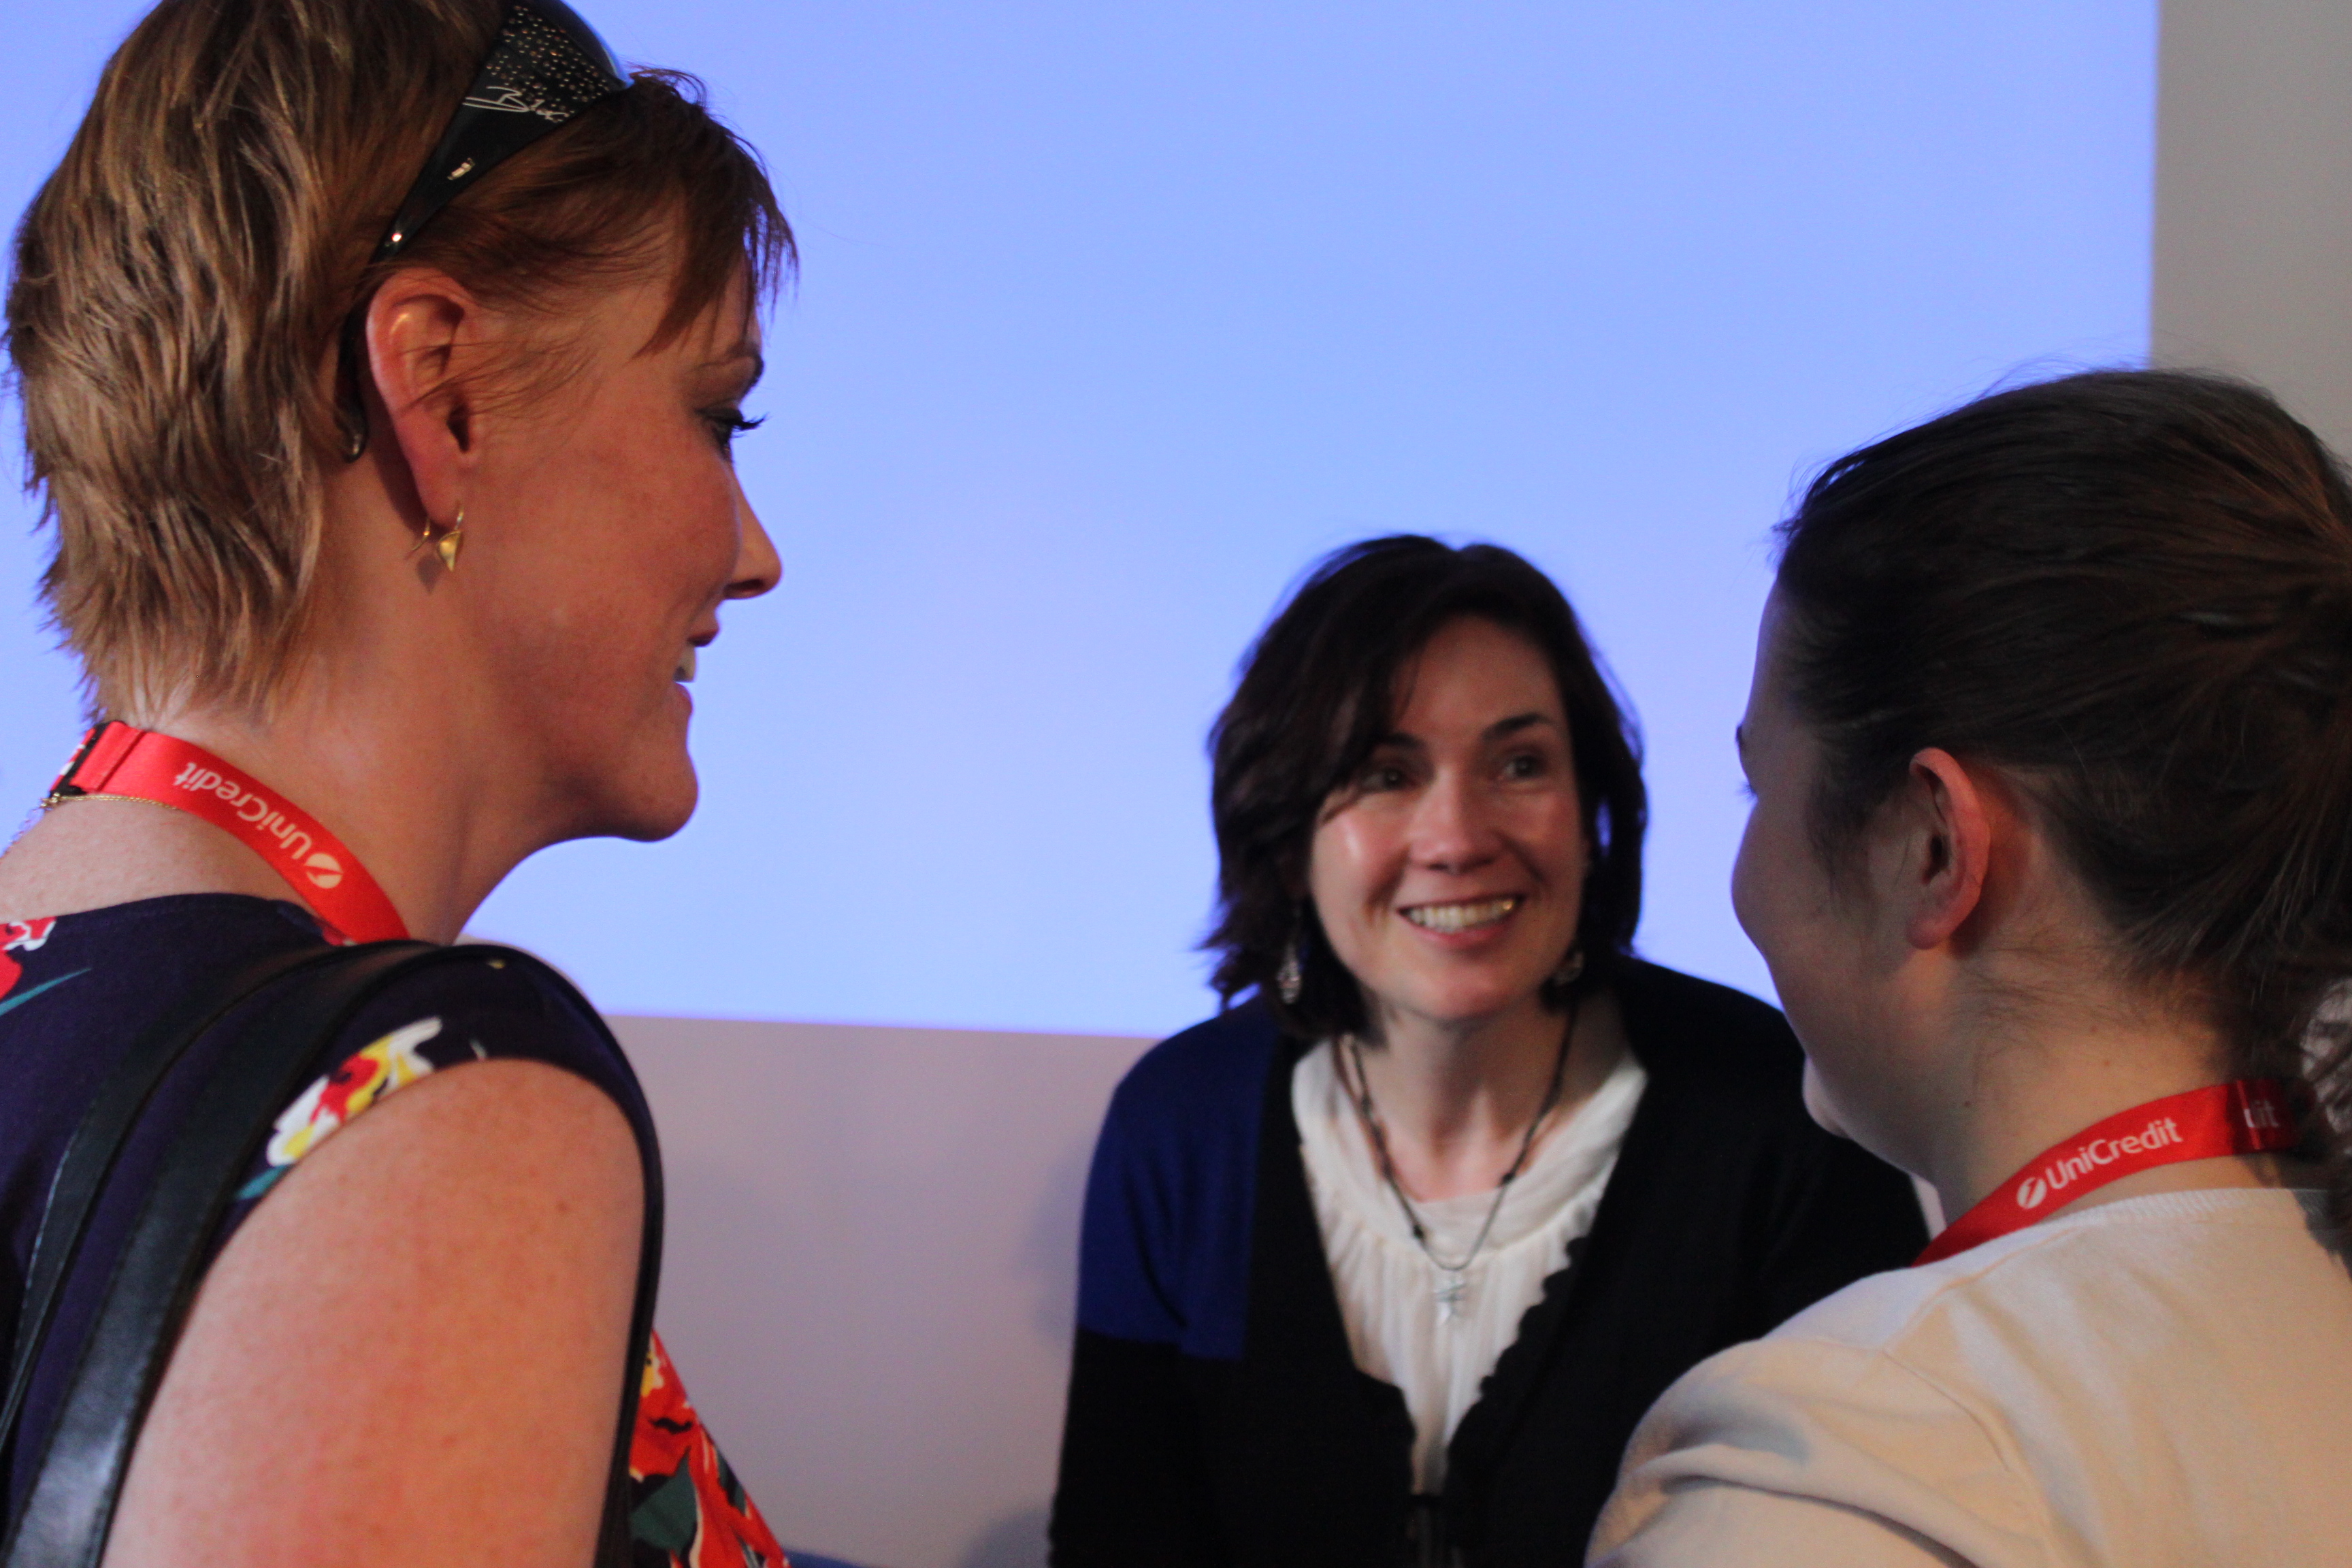
Brooke, Derbishire and Chambers at the Information Wants to Be Free session
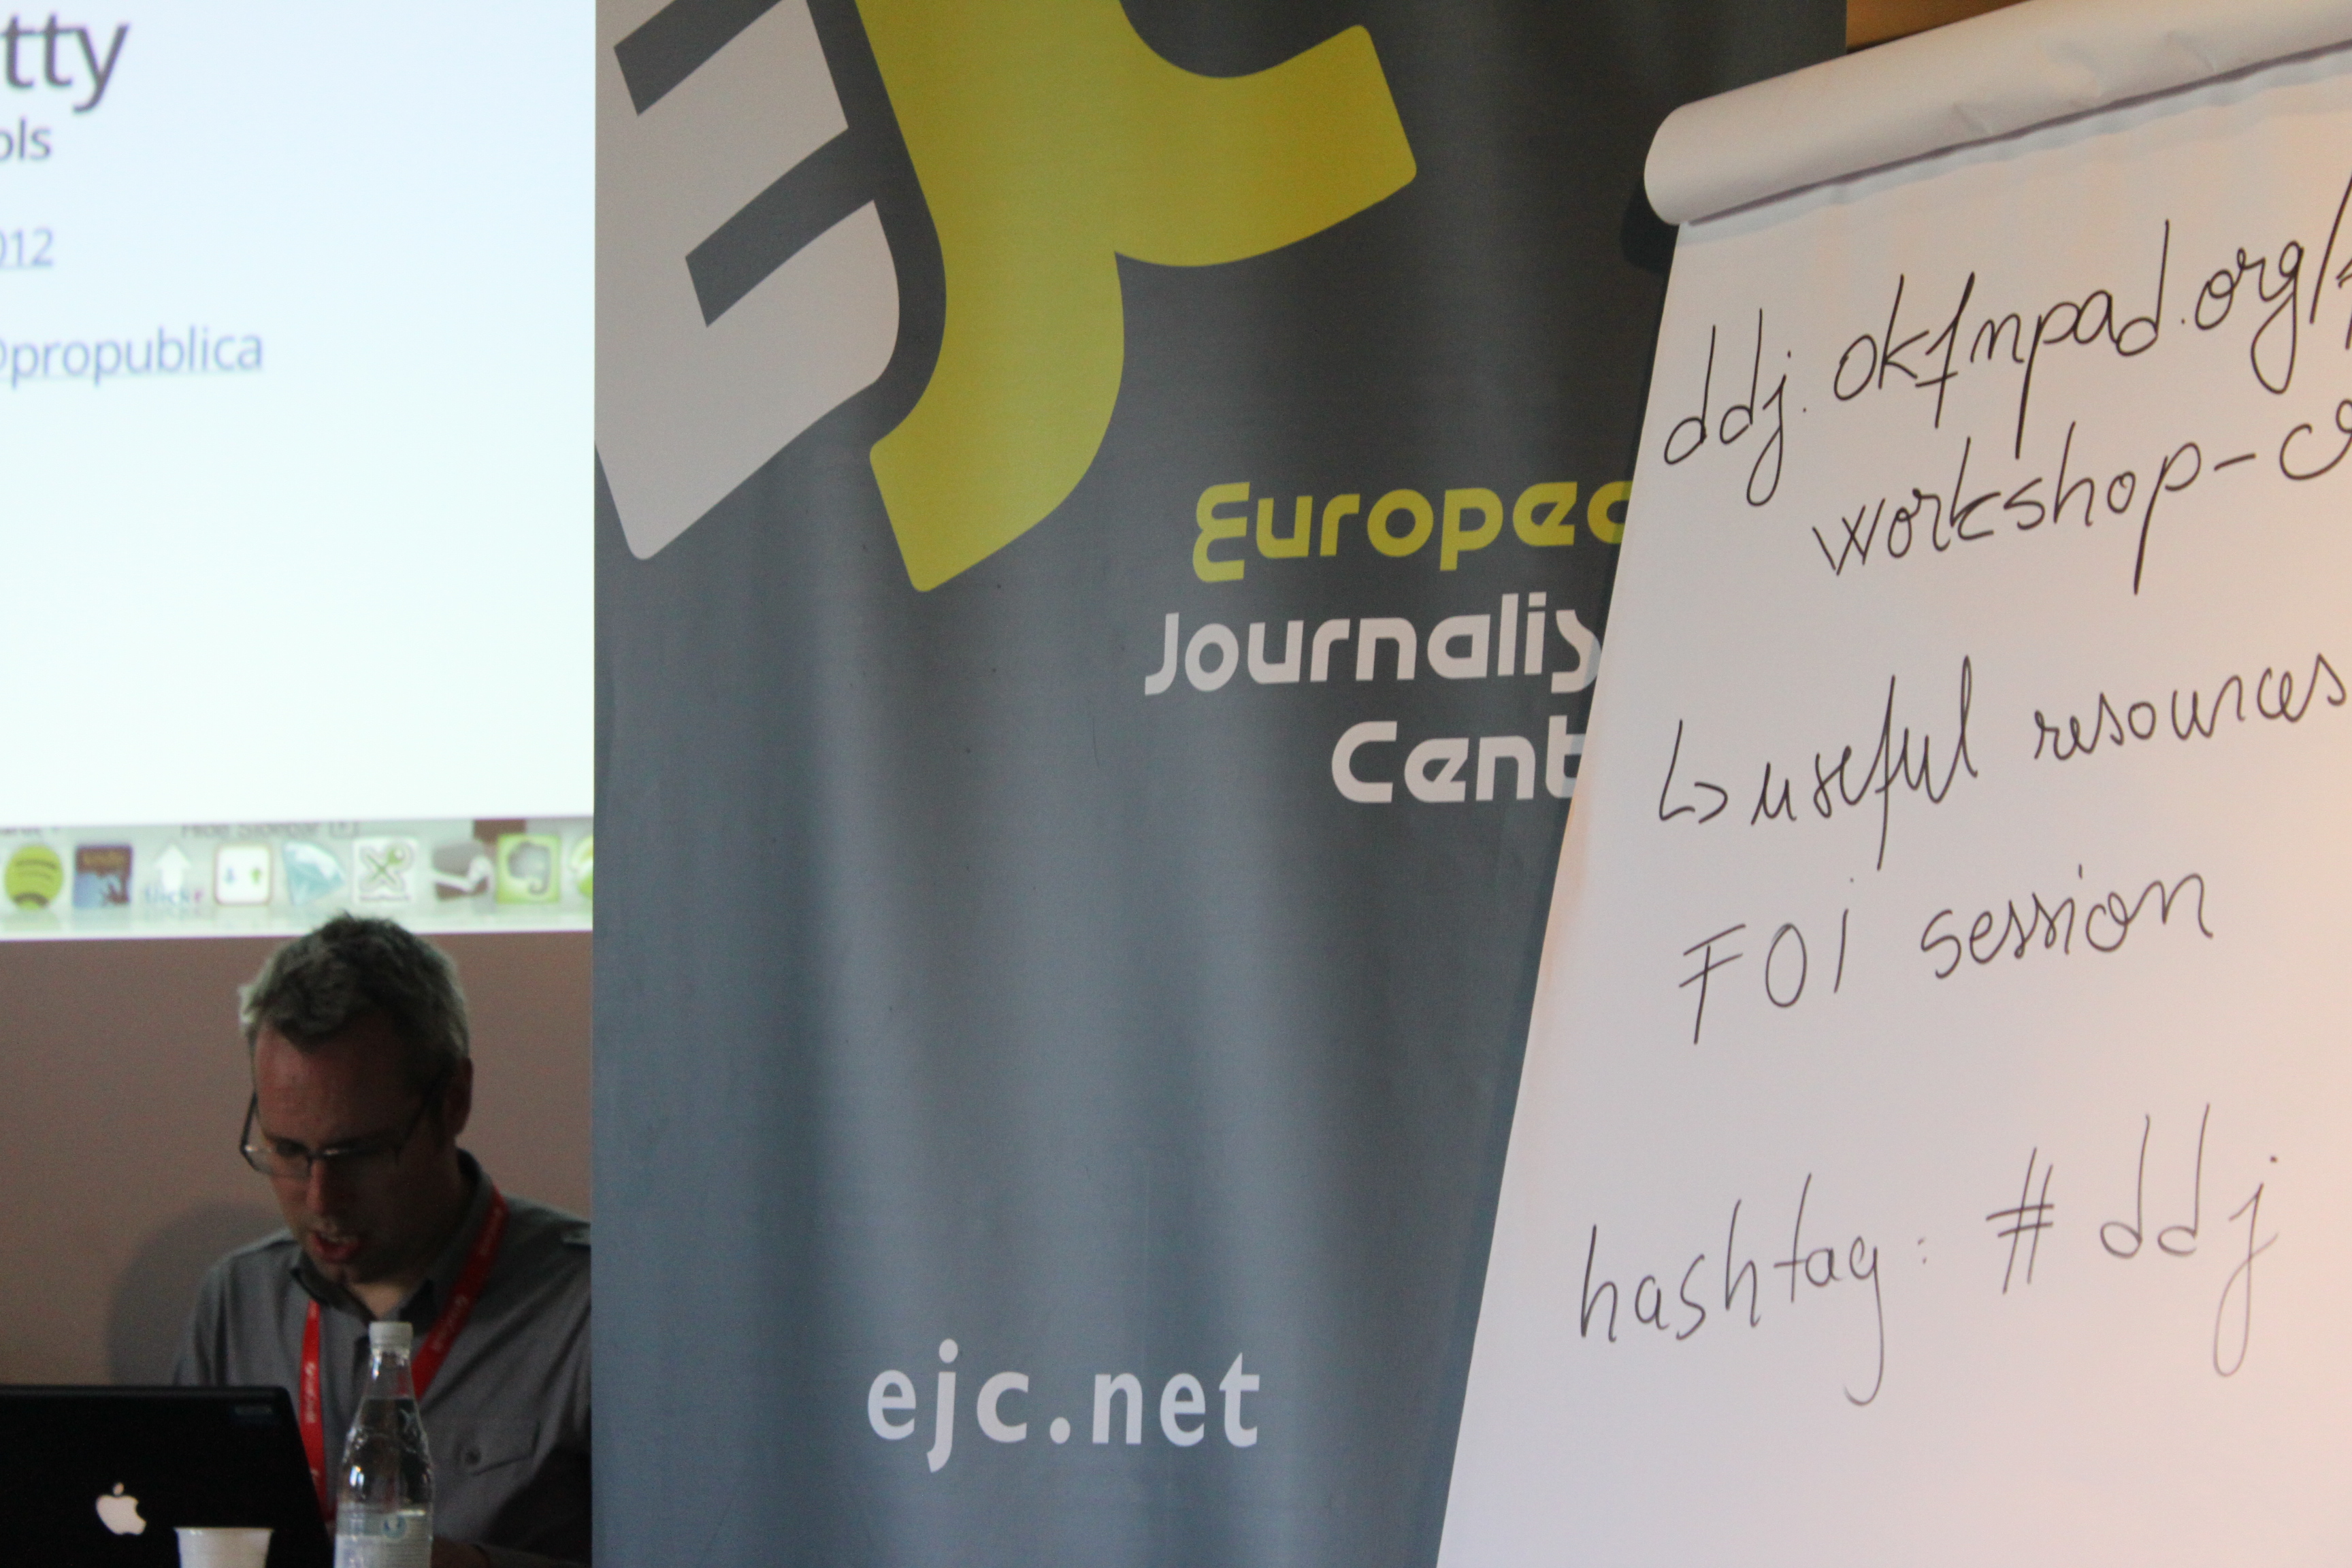
The final workshop for the day was centered on how to make data pretty and was given by Simon Rogers (Guardian Datablog), Mirko Lorenz (Deutsche Welle) and Dan Nguyen (ProPublica).
Mirko Lorenz introduced a handy and open source tool called Datawrapper to help journalist with no knowledge of coding of excel produce good data projects in an easy and timely manner. “Rule number one for a data journalist is to try and find data people can understand. The statistical office does a very good job but they do not care if people understand their data. You have to find data that people can relate to and create stories that are relevant to them.” said Lorenz presenting the tool developed in cooperation with Nicolas Kaiser-Brill.
Dan Nguyen of ProPublica shared his presentation with the audience and his tips on how to create effective visualisations readers can fully grasp and interact with. “My advise is to spend time understanding data and what makes it good. Collecting data is the hardest part of the process, as most of the time data needs to be cleaned and mistakes corrected”.
Guardian Datablog editor Simon Rogers during the Making Data Pretty workshop
Nguyen stressed once more how the basic tools needed to start with data journalism are nothing more than Google and Microsoft Excel: “The quality of the data is what makes it interesting. Visualisation starts with data, don’t worry about the tools and just apply the same journalistic principles you normally use in other kinds of reporting.”
The experience of the Guardian Datablog closed the meeting, with Simon Rogers showing how to use Google Fusion Tables to create maps starting form a simple Excel sheet. In a sort of “live experiment” he invited the audience to fill in a shared google document and pick a badge to show the origin of each participant visualised on a geographic Google map.
Claudia Costa
